
Remote debugging windows kernel driver(without symbols) using windbg
In this post we are going to learn few tips and tricks to debug a Windows kernel driver without symbols in windbg.

When you have to deal with Windows kernel debugging, the only option available is using windbg. Although windbg is a powerful debugger but setting it up and debugging the kernel code(specially when the driver is non default and without any symbols) is cumbersome. Even lacks of good resources for Windows kernel debugging make it more time-consuming. Inspired from that, I decide to write a small article where I can share few of my tips and tricks related to debugging a kernel driver without symbols in windows.
Installation and Setup
For kernel debugging we will need two windows machine since it needs to be performed remotely. The system you want debug will be called here Target machine and the one that you will use to connect to target is called host machine.
You can refer to this documentation of Microsoft for instructions on how to setup remote kernel debugging link. One situation that you might need to remember is that if your target machine is a VM, then you need to set the Network type/pci device from VirtIo (Virtual network) to any real available hardware device like Intel Gigabyte pci device.
Once you have done with setup and remote debugging has connected on the host, the first thing you might want to do is load all the symbols in windbg.
kd>.sympath srv*c:\MyServerSymbols*https://msdl.microsoft.com/download/symbolsThis will download the symbols from Microsoft symbol server and store it locally in C:\MyServerSymbols directory.
Few other commands that you should run before starting the debugging session are following:
.prefer_dml 1to turn on DML format support on debugging window.ed nt!Kd_DEFAULT_MASK 0xFFFFFFFFto change the default debug bit mask so that all debug messages from the target system will be displayed in the debugger.
You will also need IDA for statically analyzing the driver file. You can download the freeware version from hex rays official website.
Debugging the driver
In case you are debugging a Windows driver without symbols, setting breakpoint at the driver code can be your's biggest challenge since you need to provide the addresses of function rather than symbols to break at the driver code. The driver you are interested in debugging can be fall under any of the two conditions.
- The driver is standalone driver that can be loaded manually using
pnputil,net installor any 3rd party driver loading tool. - The driver is part of some installed application and is present at
Windows\System32\driverslocation.
In both the cases it's better to break at the time when driver is just loaded(and DriverEntry hasn't been executed). You can use the following windbg command to do that.
kd> sxe ld drv.sys
This will break at first chance of the driver. From there you can step next or add another break point at DriverEntry.
In first case you can just load/install the driver using pnputil or any other method. But for later case, you need to reboot the machine using
kd> .reboot
So that windows perform the driver loading again.
You can check if your driver is loaded or not using
kd> lm
Our next task is to break at the DriverEntry or any other function that we are interested in debugging.
Breaking at DriverEntry or any driver's function
Once you have breaked on Driver loading code, you need to setup a breakpoint at DriverEntry. But since the drivers don't have symbols present, it's not possible to break by doing something like kd> bp drv.sys!DriverEntry, rather we have to find the address of DriverEntry or other interested function in memory and setup breakpoint using that address. Finding the address of a function is little tricky , we have to use any dissembler like IDA to find the address in driver file.
In case of IDA, when you see the starting address of a function, the address is not RVA from ImageBase. The address is ImageBase + Section Virtual address(.text VA)/BaseOfCode + Offset of the function in section.
For example, let's check a sample driver. sub_13574 is a random function shown in IDA where we want to break.
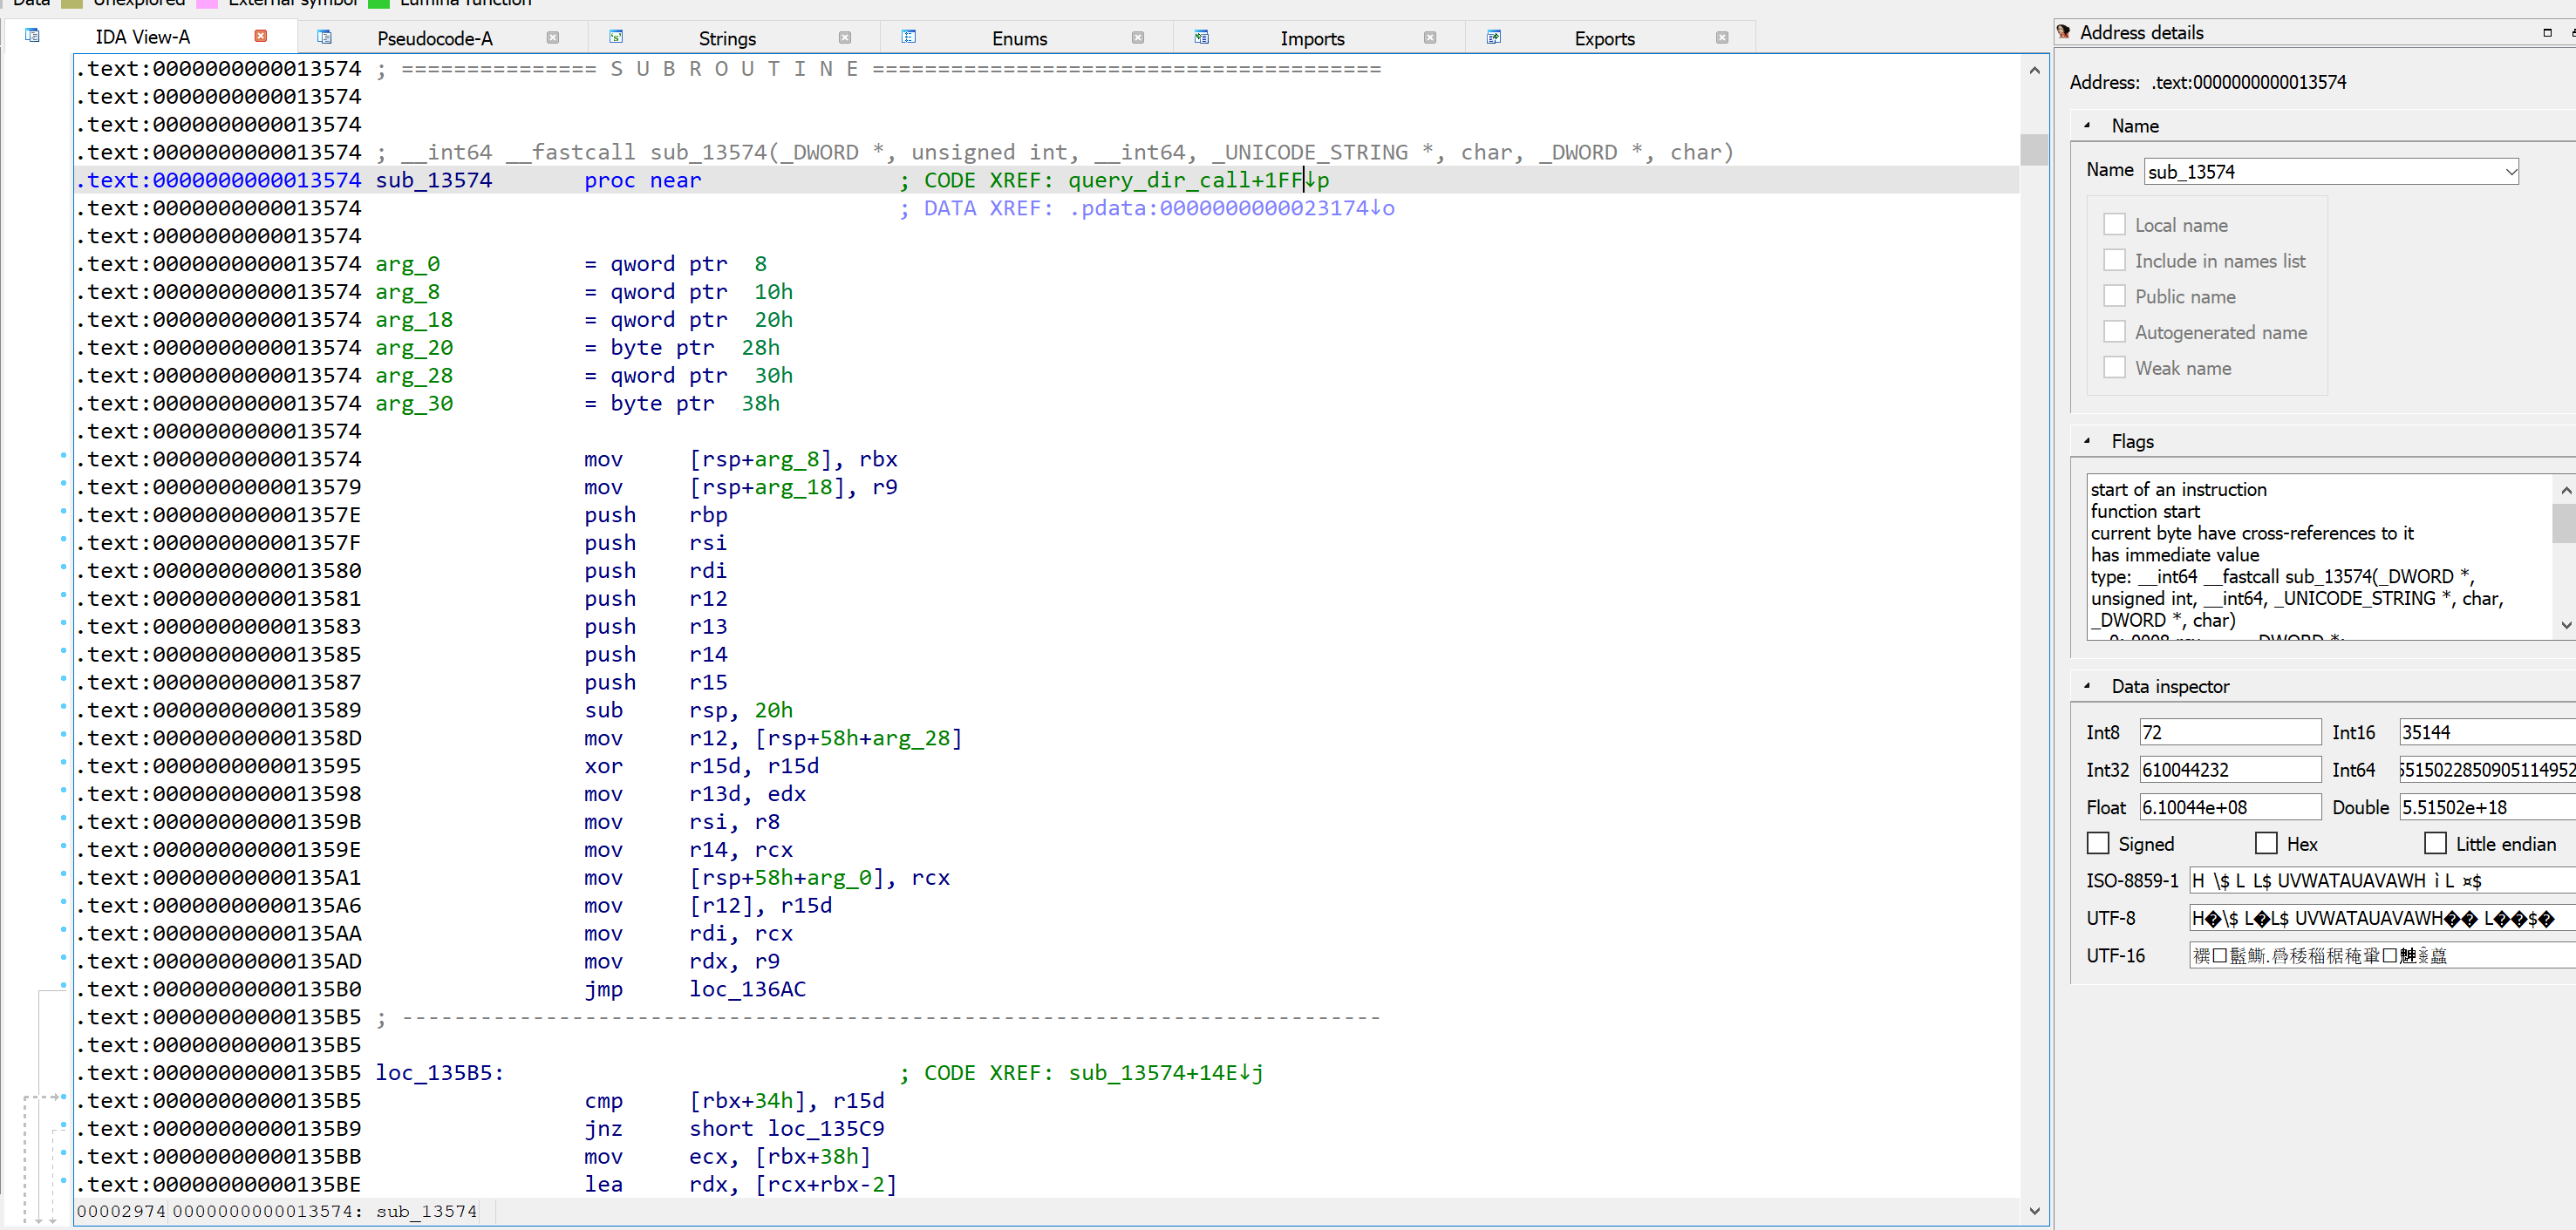
Here, the address of the function shown is 0x13574. Now check the ImageBase and VA of .text section in CFF Explorer.
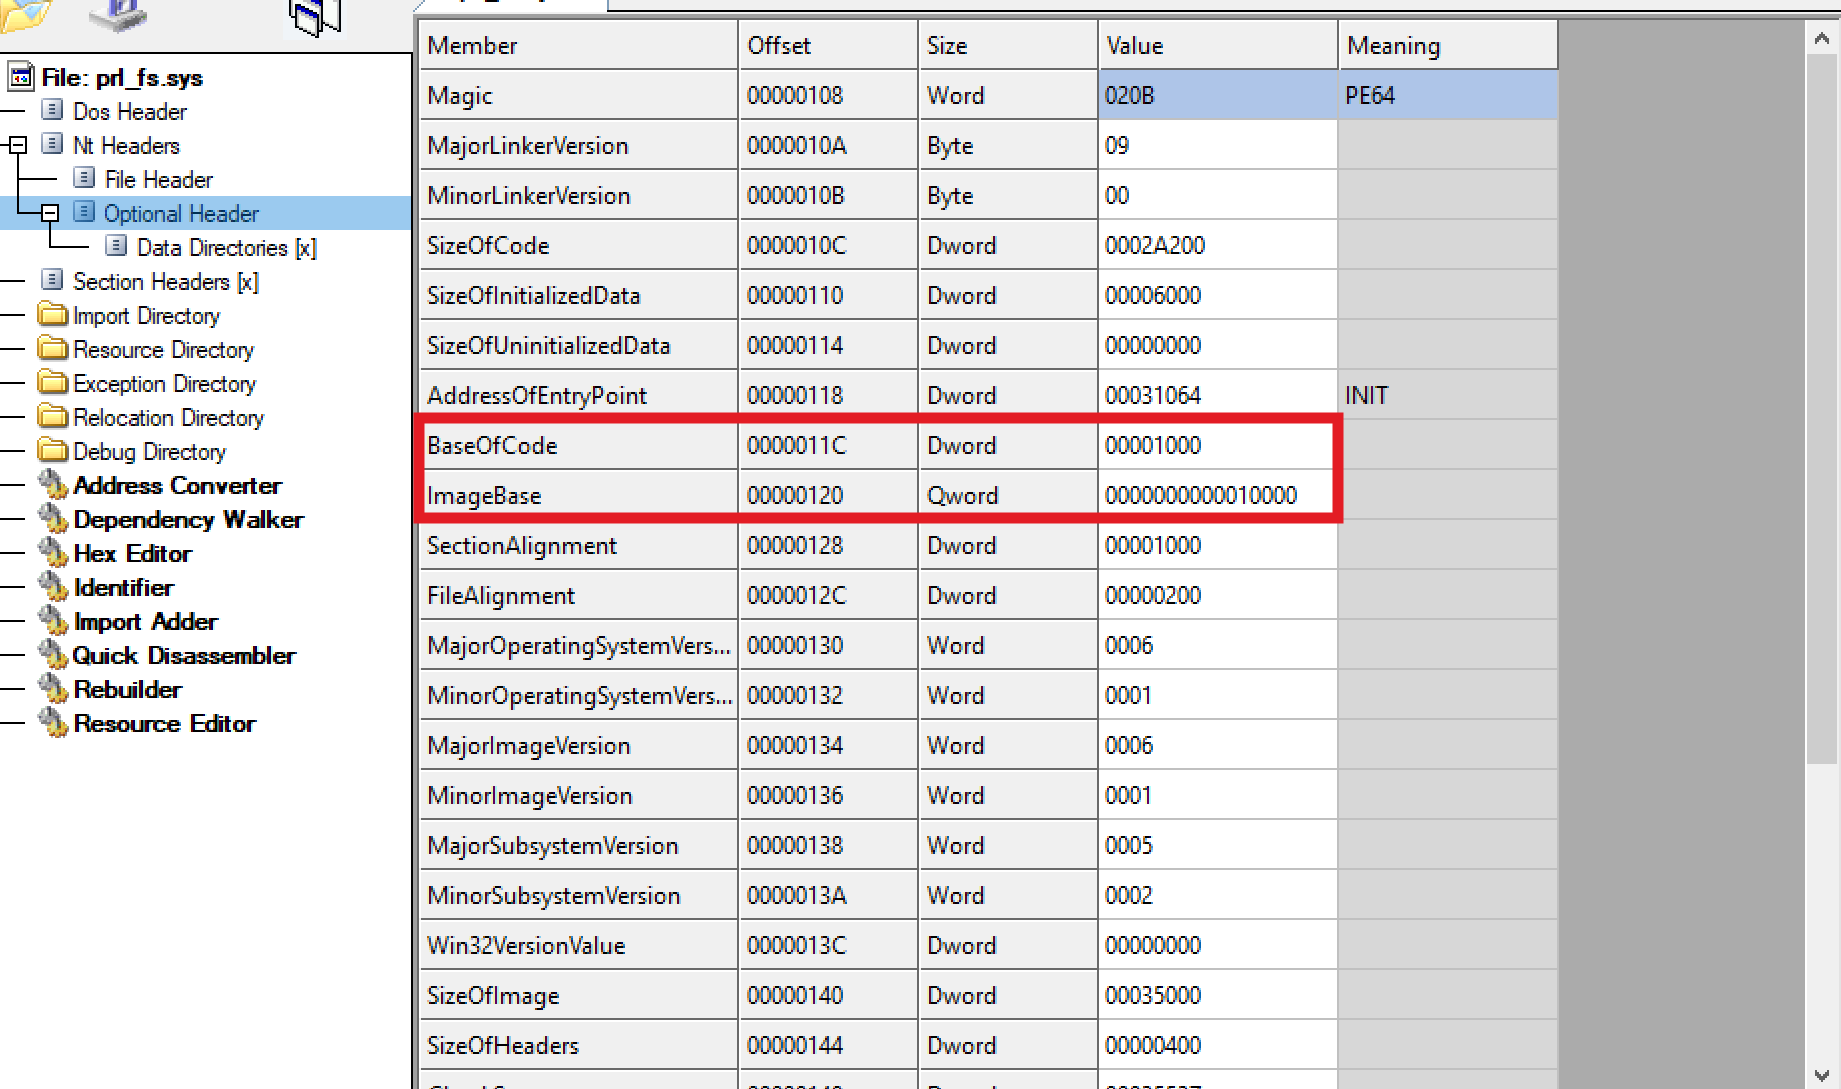
Here, we have ImageBase of 0x10000 and RVA of .text as 0x1000.
By using this information, if you want to find the address of a function in memory for a driver, you can use the following calculation:-
Address in Memory = Starting address of driver + Address in IDA(0x13574) - ImageBase (0x10000)
Let's check this address in windbg.
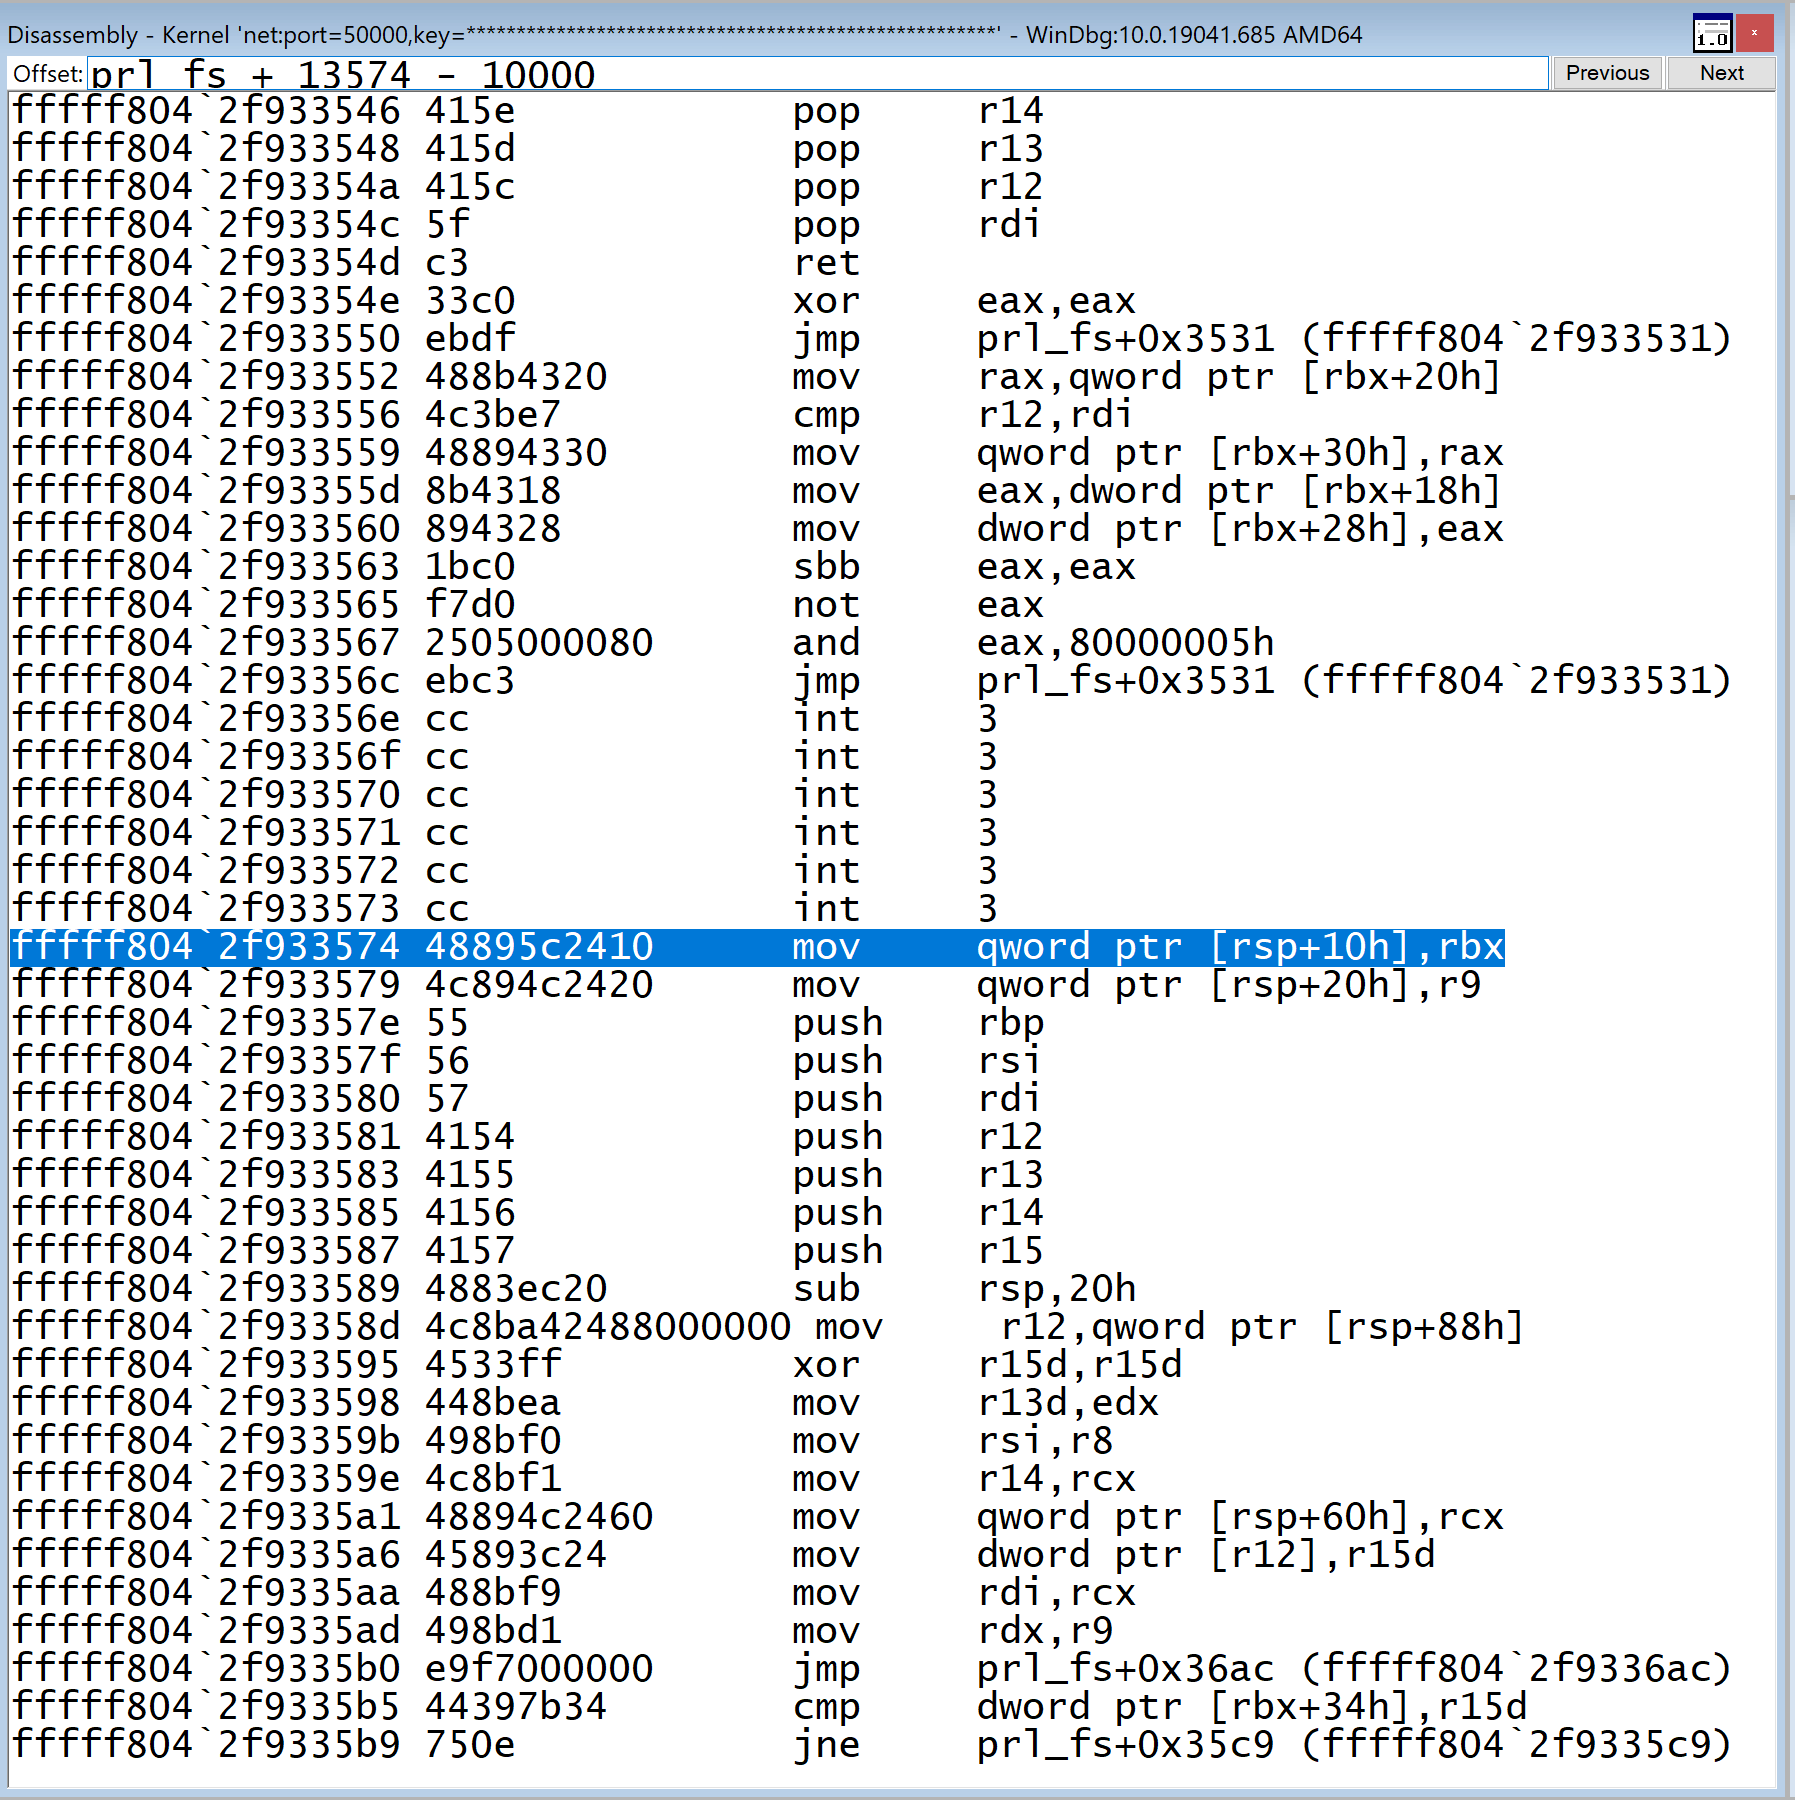
You can check that the code is same as we have seen in IDA.
Other way to check the code in windbg without using disassembly panel is by using following command.
kd> u my_drv + 0x13574 - 0x10000Now, since we know the address, we can set a breakpoint on that address using bp command and continue debugging. In this manner, you can set breakpoint at any address in the driver. After this, you can debug the driver as in other normal cases.
Finding DriverEntry code on already loaded driver (DriverEntry already executed):
If you are trying to find the DriverEntry code in windbg on a driver which is already loaded, then there is high chances that the code is not there. Mostly DriverEntry resides in INIT (initialization) section of PE file of driver. In most of the case the INIT section is marked as IMAGE_SCN_MEM_DISCARDABLE
Few important windbg commands used in kernel debugging
We have already covered how to get started with windows driver debugging in case you don't have the symbols for the driver. In this section, I will cover few basic windbg commands that are used frequently while doing kernel debugging.
- To display symbols for all drivers
kd> x*!- To dump header of the driver.
kd> !dh drv.sys- To get detailed information about the driver including Imagebase, function list etc.
kd> lm m my_drv v
or
kd> !lmi my_drv - To list down dispatch table (functions address) in a driver (useful in debugging filter drivers)
kd> !drvobj my_drv 2- Getting structure of kernel any predefined kernel object.
kd> dt _eprocess
or
kd> dt _kthread- Mapping a memory address to some structure.
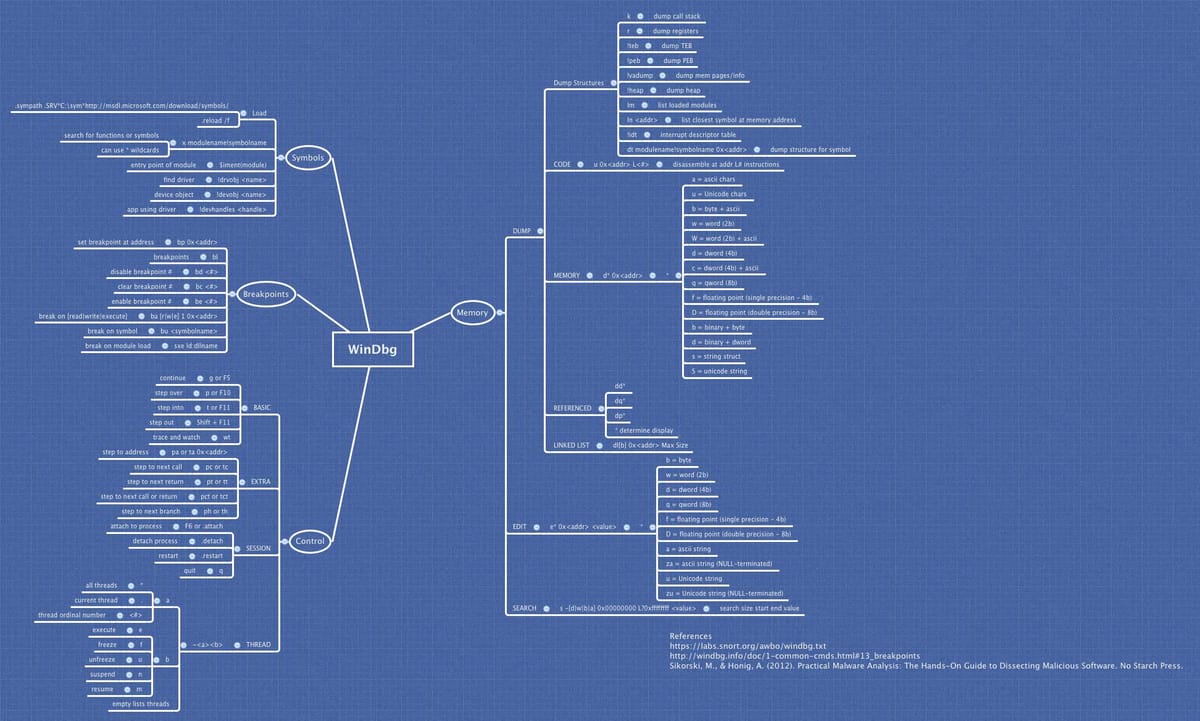
kd> dt _eprocess <address>Rest of the command are same as in usermode debugging. You can checkout the windbg cheet sheet here.